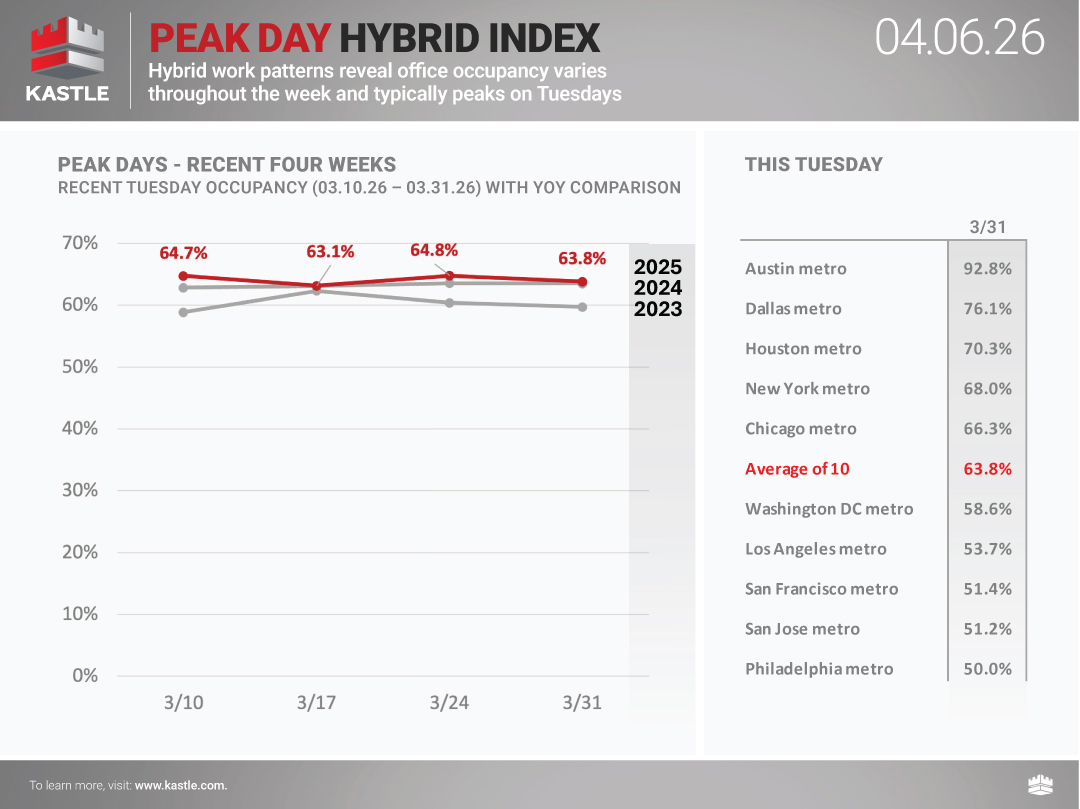
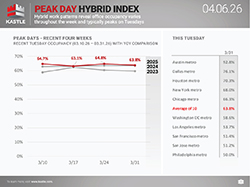
Hybrid work patterns reveal occupancy varies throughout the week with Tuesdays typically being the highest day of the week and Fridays being the lowest. The chart below tracks Tuesday occupancy over time in ten cities and provides a new dimension to the weekly Barometer report. The Peak Day Hybrid Index will now be published weekly, offering a wider aperture into the full picture of workplace occupancy.
Get Weekly UpdatesYou can now track the Return to Work Barometer on the Bloomberg Terminal, available under {ALLX KASL<GO>}
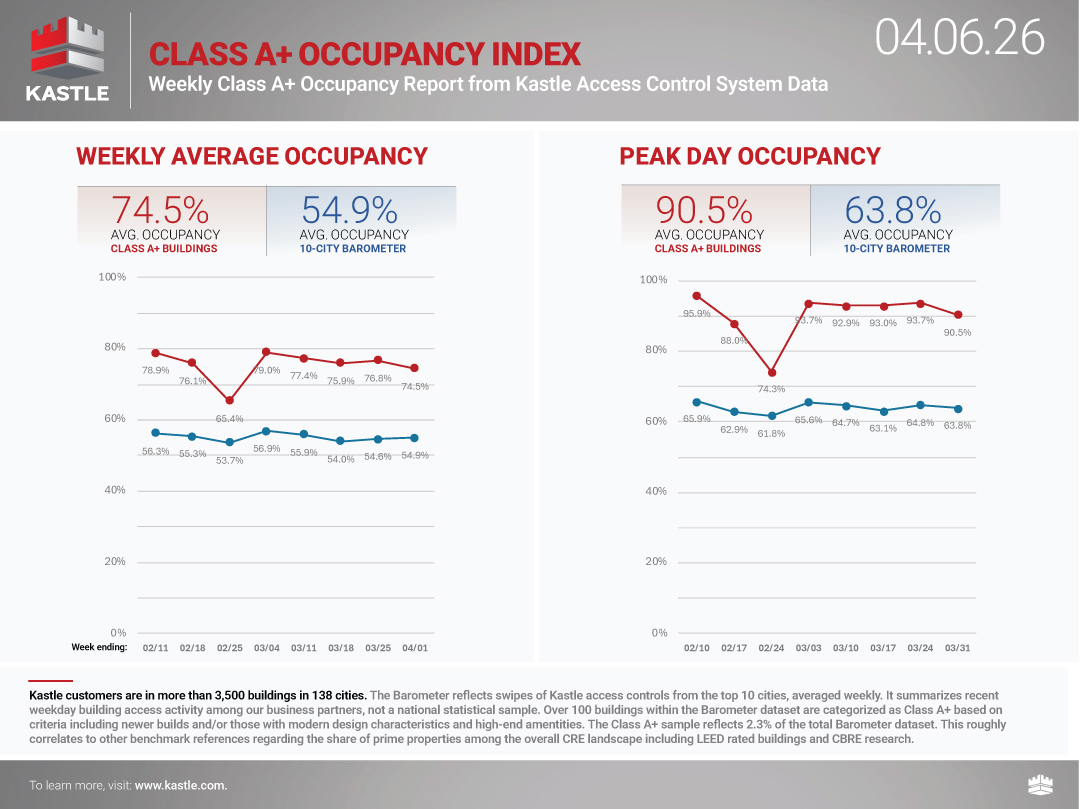
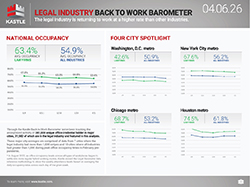
Class A+ Occupancy
Posting numbers almost identical as the week before, workers in Class A+ buildings maintained their very high occupancy rates with weekly attendance at 78.7% nationally, just a tad higher than the 78.5% from the prior week. Tuesday continued as the peak occupancy day of the week, with April 28th coming in nationally at 95.3%, just a tad lower than the prior Tuesday at 95.5%, very consistent week-to-week numbers indeed. Looking back at prior April/May periods we expect this pattern to continue, barring some major weather event or upheaval.
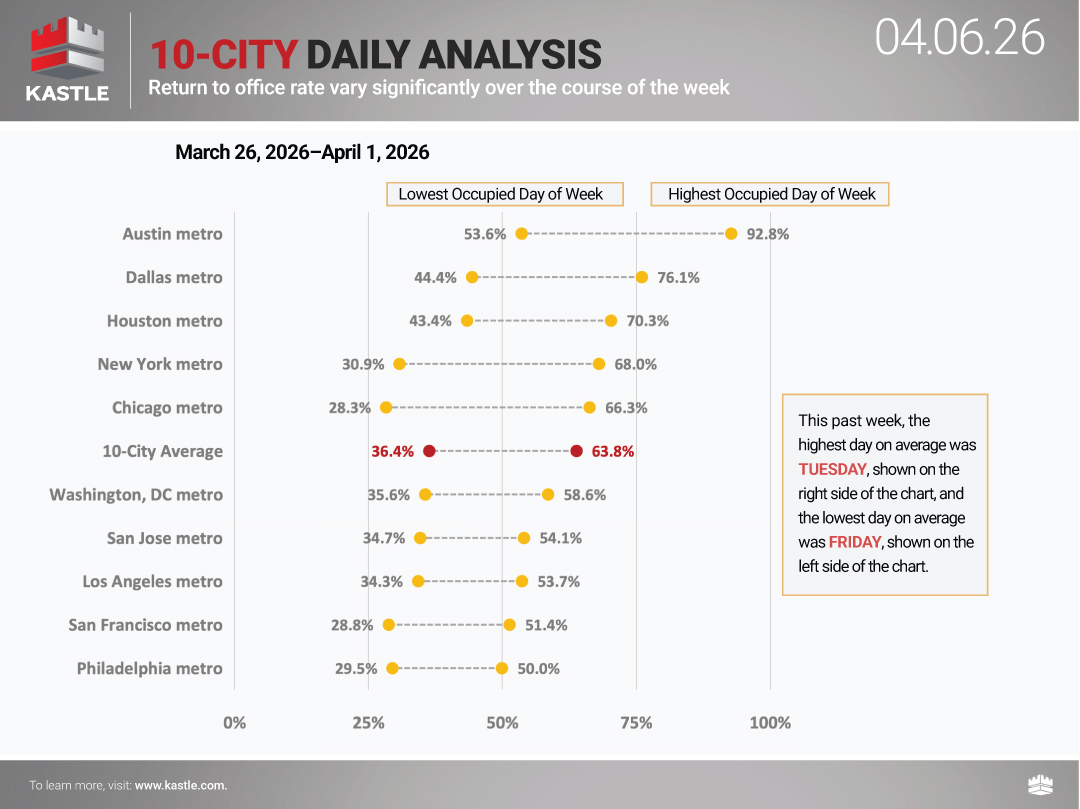
Peak Day
The 10-city Barometer reported the peak day last week as Tuesday, April 28th, with occupancy of 64.6%, identical to the prior week’s Tuesday report. Nine of the ten cities in the Barometer experienced Tuesday as their peak day. The exception was Los Angeles where Wednesday was just two tenths higher than Tuesday, at 55.0% The familiar regional patterns remained very consistent with Texas cities leading the way, followed closely by Chicago and New York. Philadelphia and New York bear watching closely as each city is just a few points below their all-time highs for peak occupancy, where 54.8% is Philadelphia’s all-time high, and 73.1% is NYC’s top peak day ever.
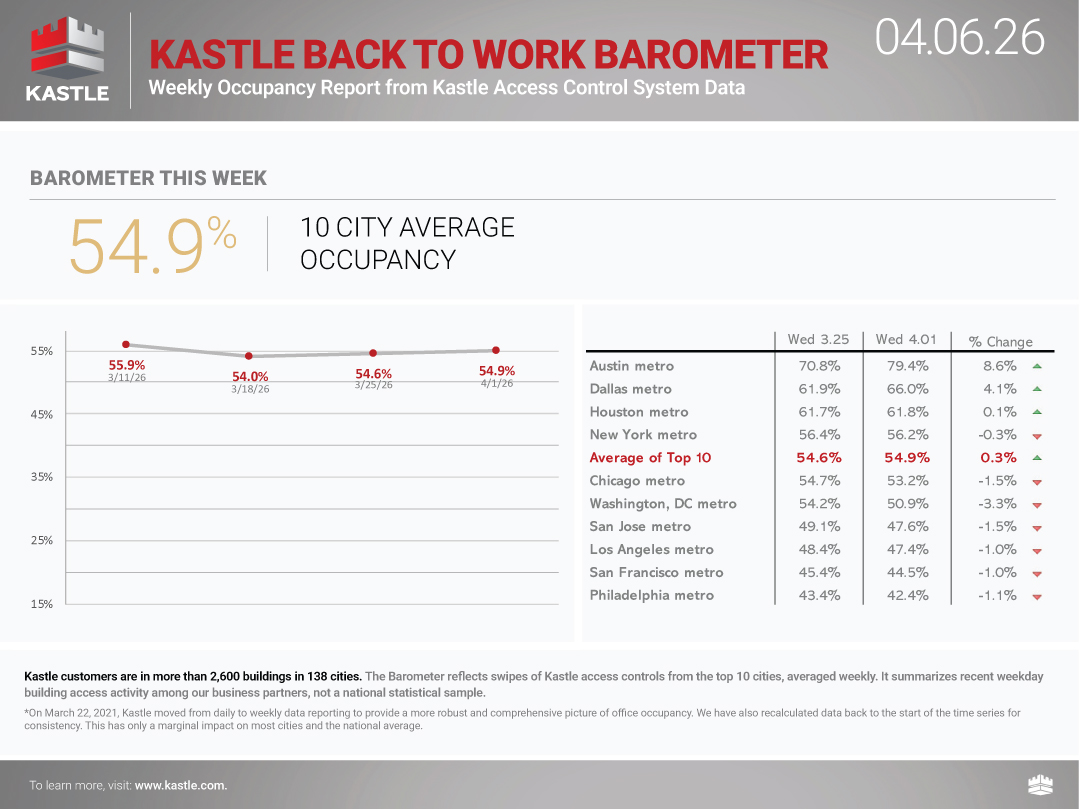
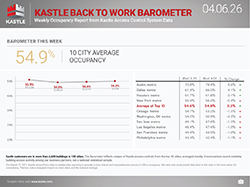
Weekly Average
The Kastle Barometer national weekly average occupancy was 55.0% this week, a slight drop from the prior week’s 55.2%. Despite this minor statistical dip, six of the ten cities in the Barometer saw their weekly average increase. Dallas was with biggest mover, down 2.4% from their prior weekly average 62.4% occupancy. The other nine cities reported much smaller shifts week to week, all moving up or down less the 1.1%, while Austin reported the exact same rate of 73.4% as the prior week’s average. We expect these numbers to be very stable to increase slightly through May until the start of summer vacation time.
Methodology
To provide some clarity on the issues facing American businesses, Kastle has been studying keycard, fob and KastlePresence app access data from the 2,600 buildings and 41,000 businesses we secure across 47 states. We’re analyzing the anonymized data to identify trends in how Americans are returning to the office.
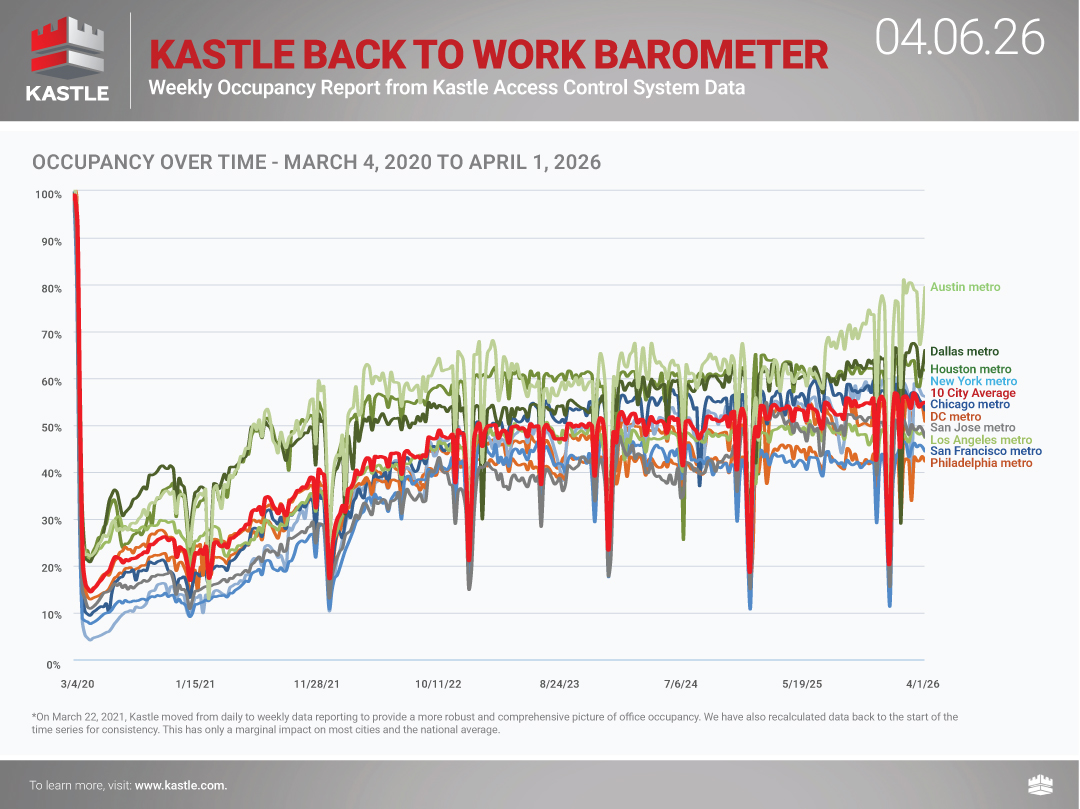
We have tracked and published U.S. office occupancy status in Kastle-secured commercial properties since the beginning of the Covid crisis in early 2020. We continue to seek to help companies navigate the ever-changing workplace landscape and adjust to the ‘new normal’ of office occupancy. Whether full-time hybrid or in-person, our commitment remains to helping American businesses understand how average workplaces are being attended weekly, monthly, and annually.
Kastle’s reach of buildings, businesses and cardholders secured generates millions of access events daily as users enter office complexes, and individual company workspaces. The Barometer weekly report summarizes access control data among our business partners in ten major metro areas, not a national statistical sample. Charted percentages reflect unique authorized user entries in each market relative to a pre-COVID baseline, averaged weekly.*
*On March 22, 2021, Kastle moved from daily to weekly data reporting to provide a more robust and comprehensive picture of office occupancy. We have also recalculated data back to the start of the time series for consistency. This has only a marginal impact on most cities and the national average.
Click here for more information about the Barometer methodology and FAQ
Ready to make your property smarter and more secure? Connect with Kastle's experts to find the perfect solution tailored to your needs.

![]()
 Workplace Occupancy Barometer
 Legal Occupancy Barometer
 Barometer Data Science