
After 42 months of reporting on office access activity to gauge occupancy patterns form thousands of Kastle-secured buildings nationwide, it’s clear the country has shifted to a new hybrid office work pattern. Especially over the last year, we see more offices across the nation buzzing with activity – albeit only on Tuesdays, Wednesdays, and Thursdays.
Office occupancy is at its highest level since the pandemic, recently reaching 50.4% of the weekly pre-Covid average occupancy. That comparative ratio is based on a 5-day in-office routine that doesn’t necessarily exist today since the typical employer is asking staff to spend roughly 3 days each week working in the office.
The Kastle Back-to-Work Barometer* tracks office occupancy today versus pre-pandemic levels from February 2020 when it launched. Prior to February 2020 there was less day-to-day variation in occupancy each week because most people worked most of the 5 day work week in the office.
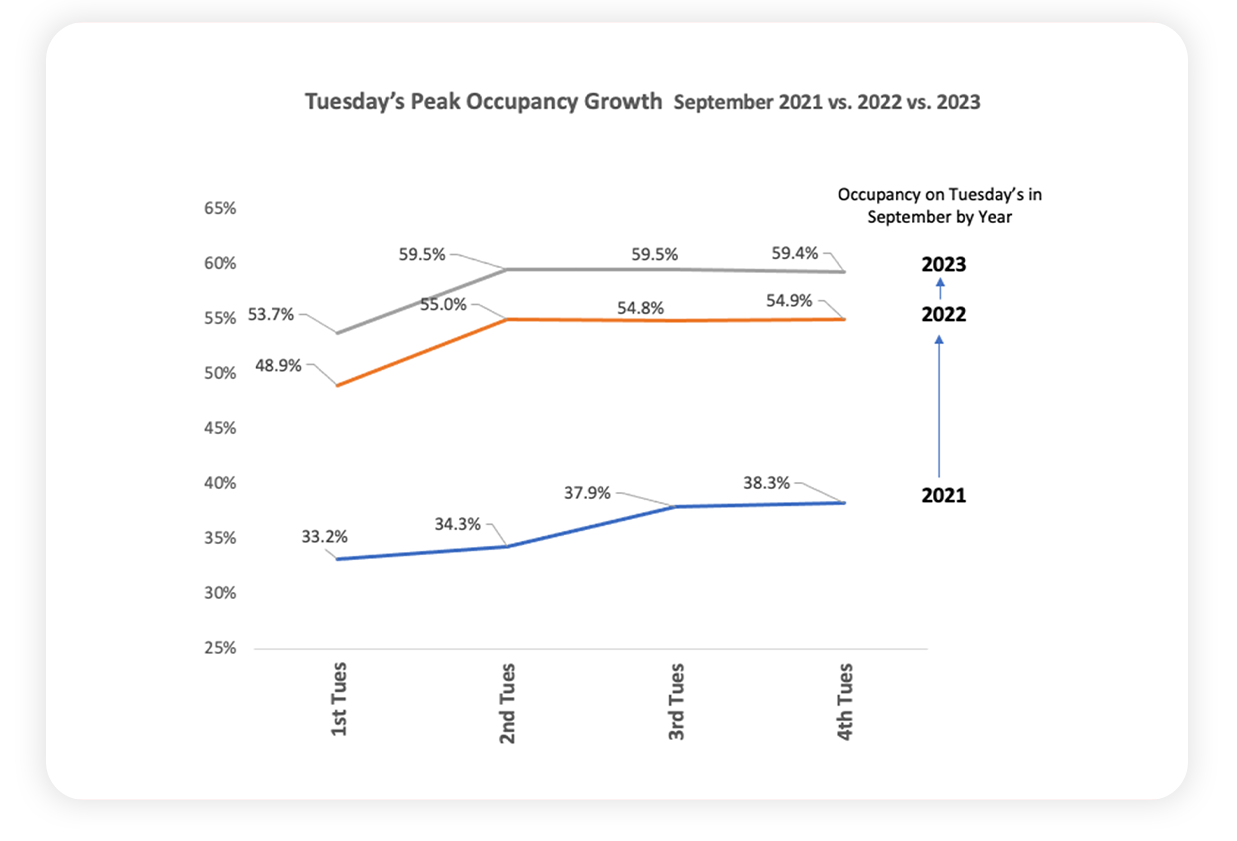
In today’s 3 days-in-the-office hybrid environment, a better measure of true workplace occupancy may need to include only the “hybrid peak” days of Tuesday-through-Thursday According to Kastle’s data, those three days currently average 58% of pre-pandemic occupancy, and is recently rising. Tuesdays have risen to almost 60% in 2023 as you can see In the chart below.
“In Chicago, some September days had a return rate of over 66%,” writes Peter Grant in the Wall Street Journal “But it was below 30% on Fridays,’ he adds.
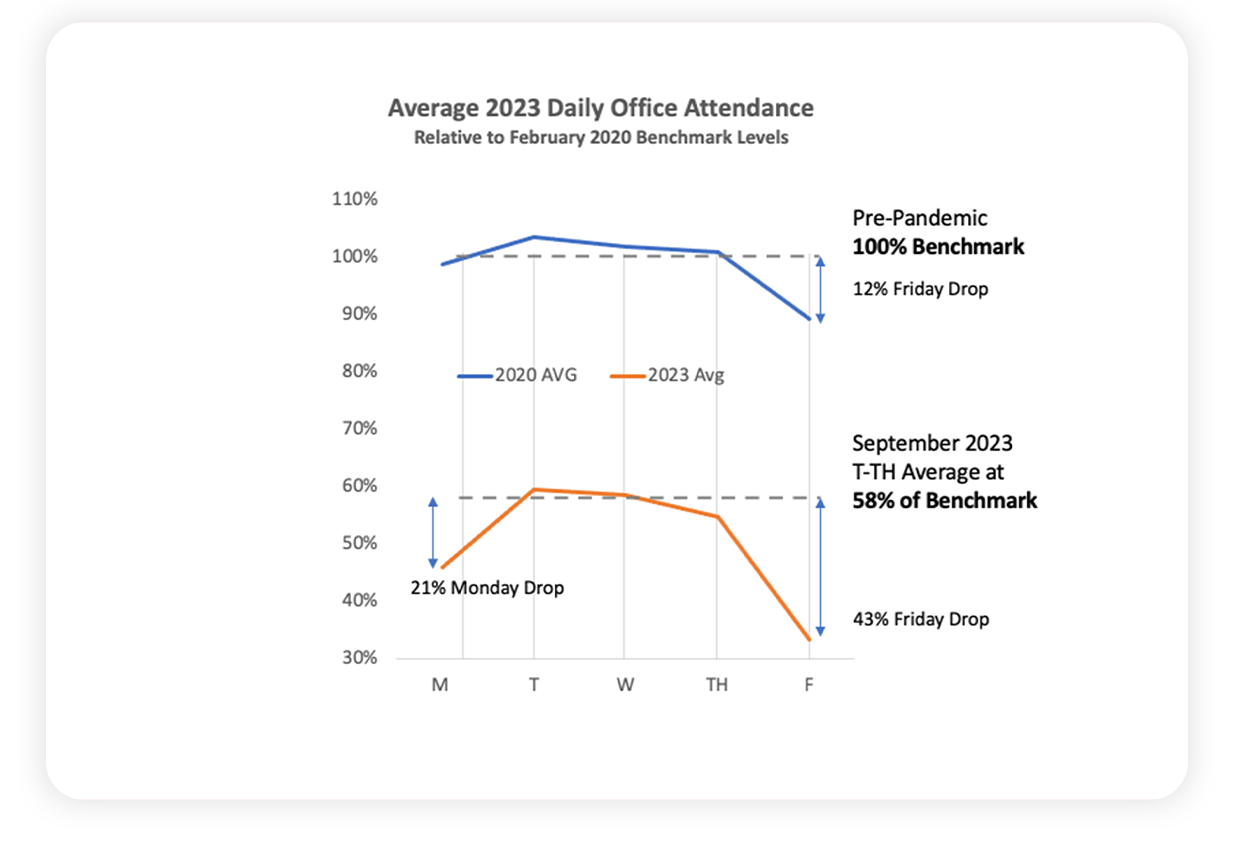
At the same time over the last year Monday and Friday attendance has dropped more dramatically. Historically, Fridays have always had a somewhat lower office attendance rate, but the drop was only 12% relative to the weekly Tuesday-through-Thursday peak attendance average. Today, the Friday drop has widened to an astonishing 43% lower than the peak T-W-TH average.
Before March of 2020, Monday attendance was generally within 1-2% of the weekly average peak, but post-pandemic, Mondays now drop 21% below the current weekly mid-week average.
These major differences in occupancy during the week help explain observations that buildings are buzzing, when weekly averages hover at half their Pre-pandemic levels. To help our customers better understand the new hybrid work environment, Kastle will soon launch a new measure focusing on the mid-week peak activity.
*The Kastle Back to Work Barometer uses average weekly attendance counts (first-time card swipes each day then averaged across the five-day week) of February 2020 as the pre-pandemic benchmark attendance level and timeframe – e.g., the average weekly attendance counts captured at that pre-pandemic timeframe are what all subsequent daily and weekly attendance counts are compared to as a relative percentage, with February 2020 counts as the denominator, and current count each day as the numerator.
