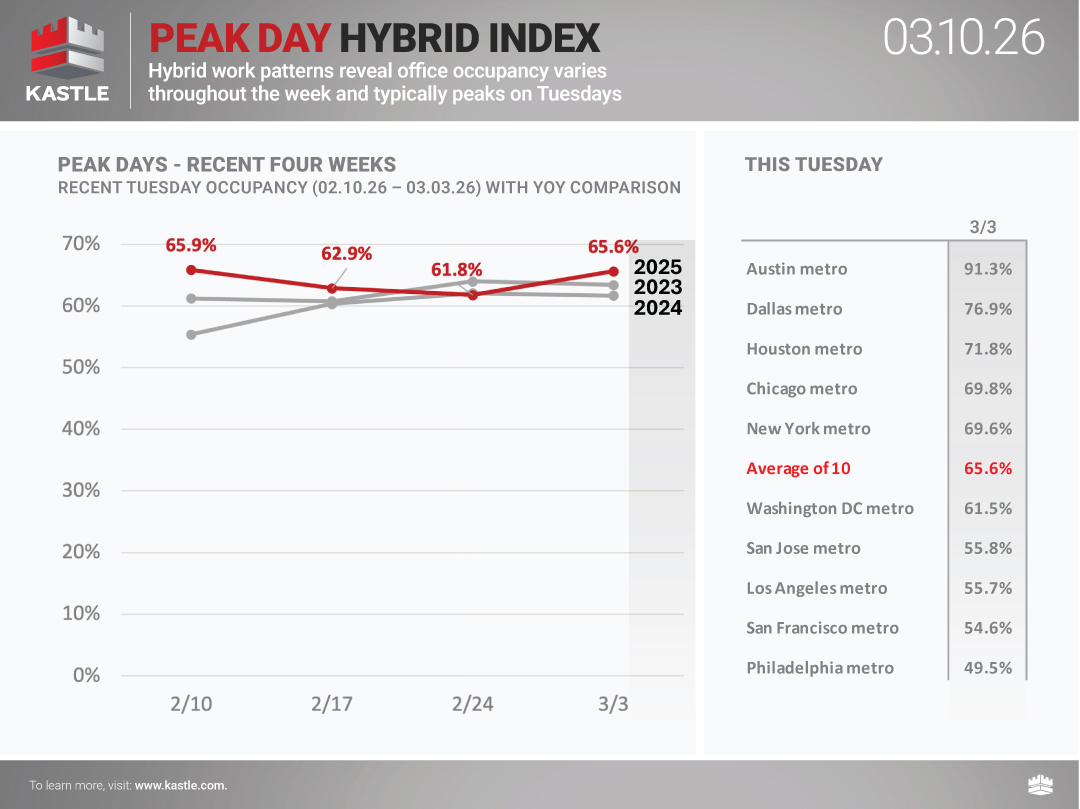
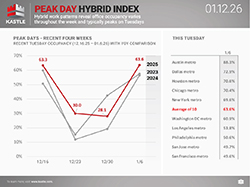
Hybrid work patterns reveal occupancy varies throughout the week with Tuesdays typically being the highest day of the week and Fridays being the lowest. The chart below tracks Tuesday occupancy over time in ten cities and provides a new dimension to the weekly Barometer report. The Peak Day Hybrid Index will now be published weekly, offering a wider aperture into the full picture of workplace occupancy.
Get Weekly UpdatesYou can now track the Return to Work Barometer on the Bloomberg Terminal, available under {ALLX KASL<GO>}
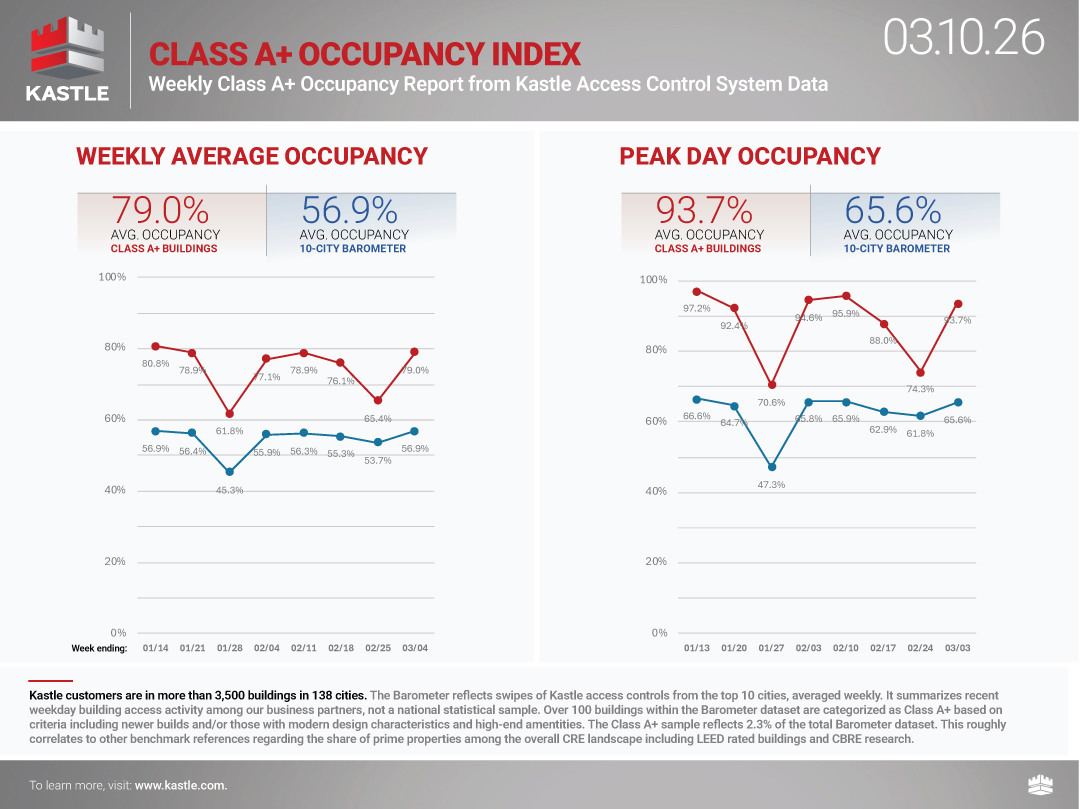
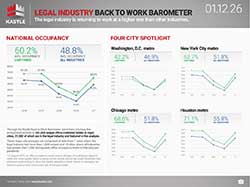
Class A+ Occupancy
A rebound from spring break was evidenced this week in Class A+ buildings with weekly attendance rising 76.8% for the week. Peak occupancy happened on Tuesday, reaching 93.7%, almost the same increase as the weekly average. It appears Class A+ buildings are repeating a historical seasonal increase in occupancy
Peak Day
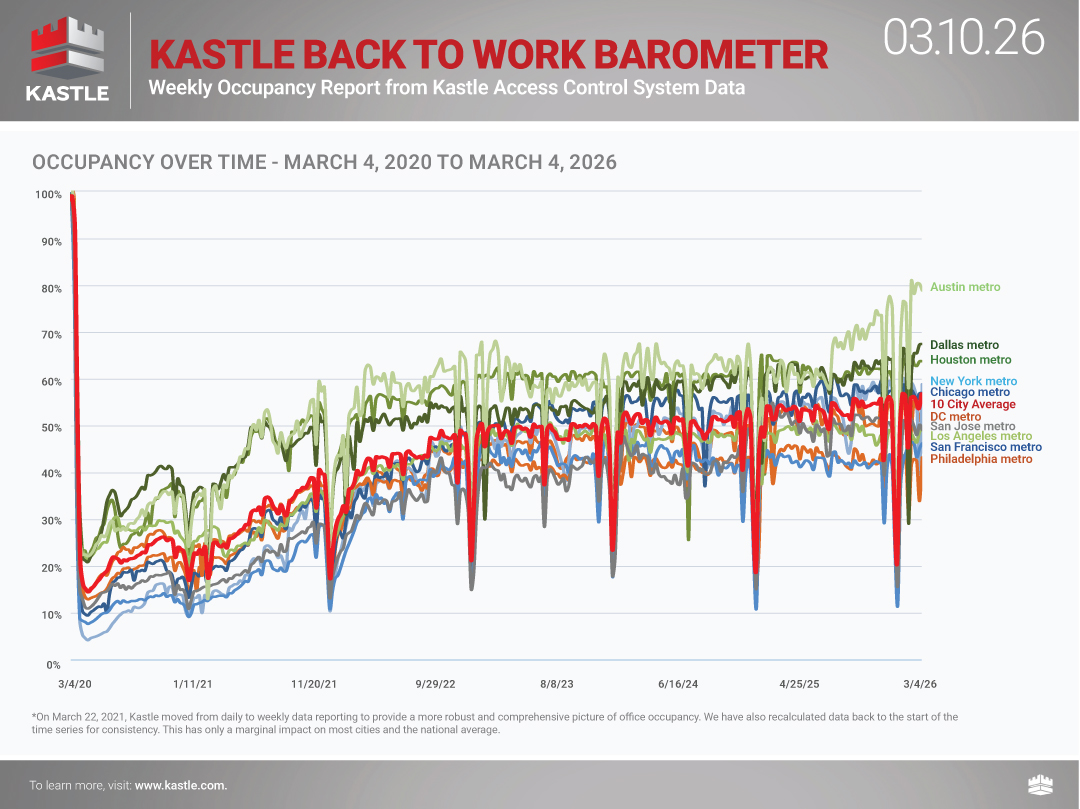
The sound of school bells ringing and back packs tossed on school desks means Spring Break is over, and parents returned to work, driving up peak day office occupancy across the Ten Cities to 64.8%. Texas cities led the way with Austin rocketing up to 90.3% on Wednesday, and Dallas jumping to 70.6% on Tuesday. Houston was a close third in the State logging in at 70.9% on Tuesday, and New York surprisingly right behind at 69.0% on Tuesday. California cities remained in the lower tier, but still strong with Spring Break coming later in the month. San Jose led the state at 58.6 on Tuesday, Los Angeles with 55.6% on, followed by San Franciso at 53.9%.
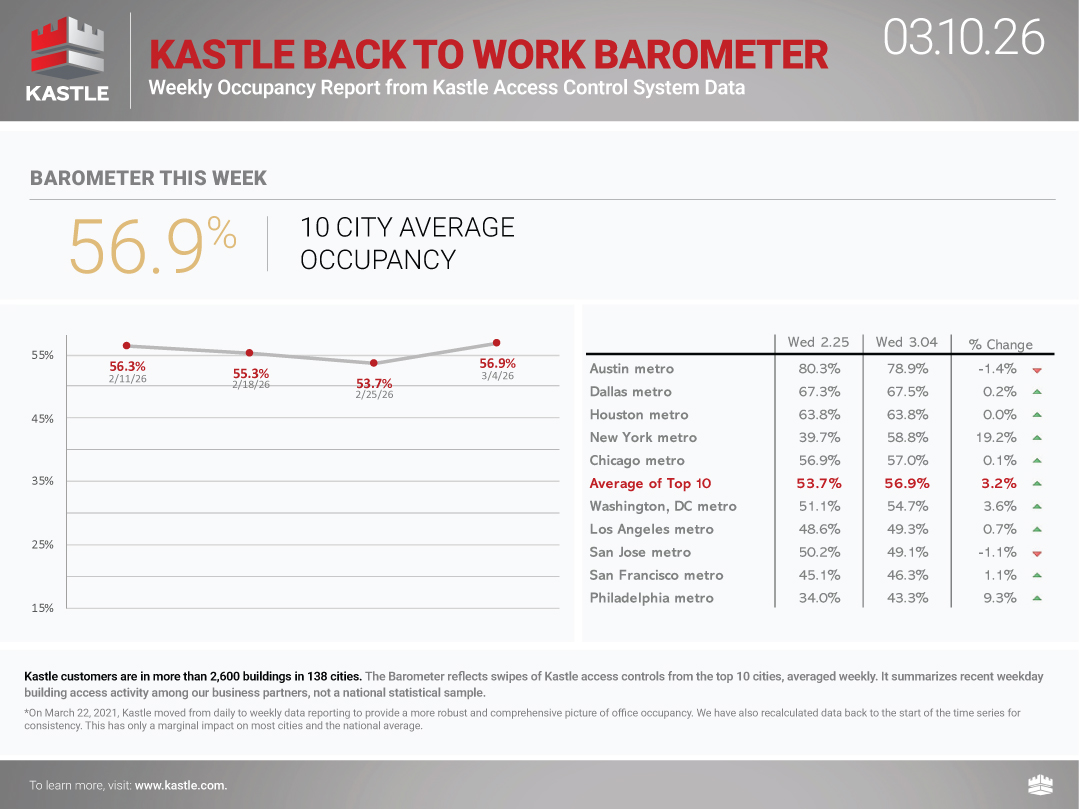
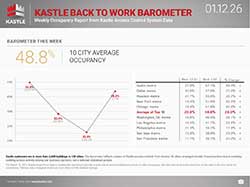
Weekly Average
Office occupancy increased slightly across the nation to 54.6% as spring vacation began to wrap up in parts of the nation. Five cities in the Back to Work Barometer registered increased occupancy rates, and the other five saw modest declines. Austin and Houston claimed the biggest weekly average increase of 3.4% over the prior week, hitting 70.8% in average occupancy in Austin and 61.7% in Houston. The biggest drop in weekly occupancy was in the New York Metro area, which fell 1.2% to 56.4% weekly average.
Methodology
To provide some clarity on the issues facing American businesses, Kastle has been studying keycard, fob and KastlePresence app access data from the 2,600 buildings and 41,000 businesses we secure across 47 states. We’re analyzing the anonymized data to identify trends in how Americans are returning to the office.
We have tracked and published U.S. office occupancy status in Kastle-secured commercial properties since the beginning of the Covid crisis in early 2020. We continue to seek to help companies navigate the ever-changing workplace landscape and adjust to the ‘new normal’ of office occupancy. Whether full-time hybrid or in-person, our commitment remains to helping American businesses understand how average workplaces are being attended weekly, monthly, and annually.
Kastle’s reach of buildings, businesses and cardholders secured generates millions of access events daily as users enter office complexes, and individual company workspaces. The Barometer weekly report summarizes access control data among our business partners in ten major metro areas, not a national statistical sample. Charted percentages reflect unique authorized user entries in each market relative to a pre-COVID baseline, averaged weekly.*
*On March 22, 2021, Kastle moved from daily to weekly data reporting to provide a more robust and comprehensive picture of office occupancy. We have also recalculated data back to the start of the time series for consistency. This has only a marginal impact on most cities and the national average.
Click here for more information about the Barometer methodology and FAQ
Ready to make your property smarter and more secure? Connect with Kastle's experts to find the perfect solution tailored to your needs.

![]()
 Workplace Occupancy Barometer
 Legal Occupancy Barometer
 Barometer Data Science